Portfolio

View and manage all your portfolios from here

    • Count of alerted entities
    • Count of red entities
    • Count of total entities
    • ST Medians 1M change
  • Sort by

Portfolio name 1

  • 8 Alerted

  • 12 Red

  • 30 Entities

  • CHG

    +0.5% ST 95th

  • CHG

    -1% MT Med

Portfolio name 2

  • 8 Alerted

  • 12 Red

  • 30 Entities

  • CHG

    +0.5% ST 95th

  • CHG

    -1% MT Med

Portfolio name 3

  • 8 Alerted

  • 12 Red

  • 30 Entities

  • CHG

    +0.5% ST 95th

  • CHG

    -1% MT Med

Portfolio name 2

  • 8 Alerted

  • 12 Red

  • 30 Entities

  • CHG

    +0.5% ST 95th

  • CHG

    -1% MT Med

Portfolio name 1

  • 30 Entities
  • 4 Regions
  • 5 Industries

Date up to: 2018-08-31

Spotlight


SIGNAL

#|%
 

Alerted


8

Entities(3 out of 8 criteria)

6M

MEAN

Aggregate PD

Annualized

12bps

Today

ST

Rating

Rating

ScoreCard

BB

1M later


KEY RF CHG

Key risk factor

Profit Liquidity
  • SalesTA
  • CashTE

6M ago

Top 10 movers

Show

Show the entities of biggest changes in 3-month PDs since 12 months ago.H

    • Apple +55% @  12.33bps

    • Xerox +44.3% @  23.33bps

    • GoPro +33% @  15.33bps

    • Nissan +22% @  52.33bps

    • Toyota +11% @  62.33bps

    • Foxcom -15% @  23.33bps

    • Xero -10.2% @  55.11bps

    • GoPro -9% @  53.33bps

    • Nintendo -5.3% @  23.44bps

    •     Tesla -3.3% @  33.62bps

Top 5 up-movers

Show

Show the entities of biggest changes in 12-month PDs to 3 months later.F

    • Alibaba +35% @  12.33bps

    • Tencent +34.33% @  23.33bps

    •      Grab +23% @  15.33bps

    • Pepsi +12% @  52.33bps

    • KFC +6% @  62.33bps

Member Entities

Show the latest information of member entities

Entity Signal 12M PD PD change Rating Recent 12 months
Nissan 86 % +34% CCC
Exxon 85 % -2% CC
Tencent 65 % -12.3% B
Alibaba 12 % +23% AAA
GoPro 24 % 23% BBB

insight

Note timeline

Show all the notes associated with the entity on different dates

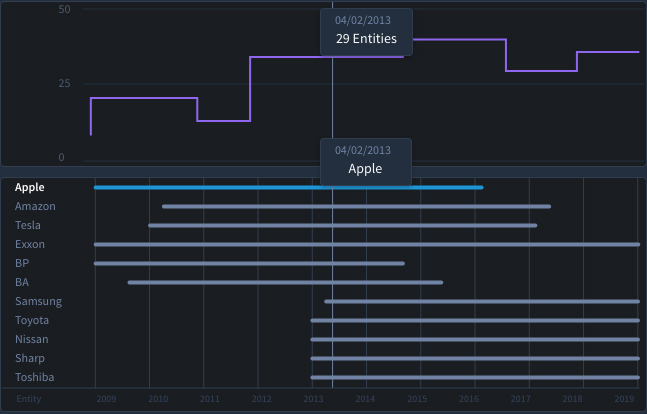
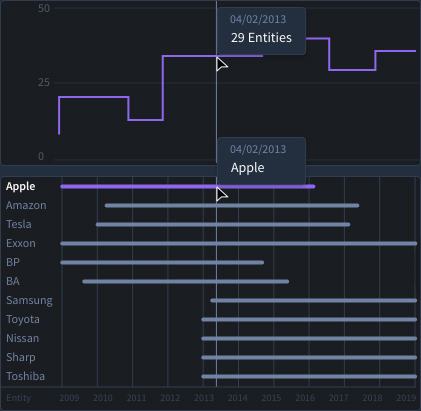
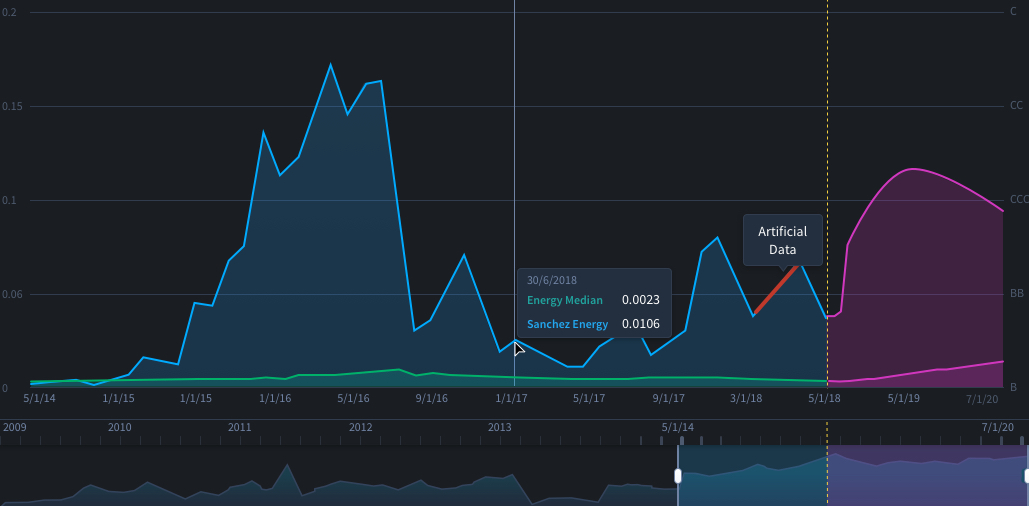
Aggregate PD & Counterparts

Show the aggregate PDs of the selected portfolio, global coverage and other selections

  • Series
    and

Industry average
Sears Holdings Corps

Historical ranking:

Show the member entities of highest PD rankings in the selected time window

  • Top 5 of ST PD

Industry average
Sears Holdings Corps

Downgrade/Upgrade H

PD cumulated from 03/12/2018 to each forward month

  • #
  • %
Industry average
Sears Holdings Corps

Downgrade/Upgrade F

Forecast 36M change in Long Term S&P equivalent

  • #
  • %

Advanced analysis

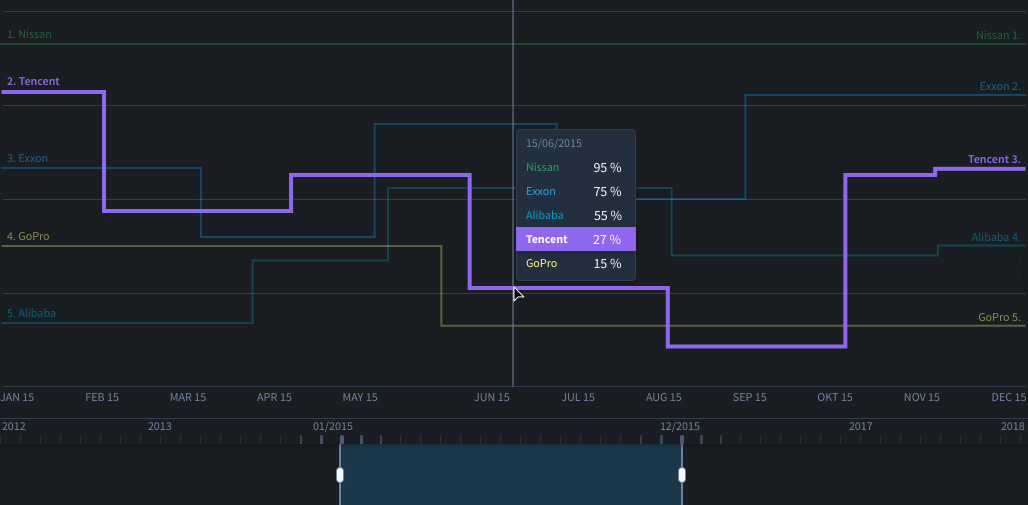
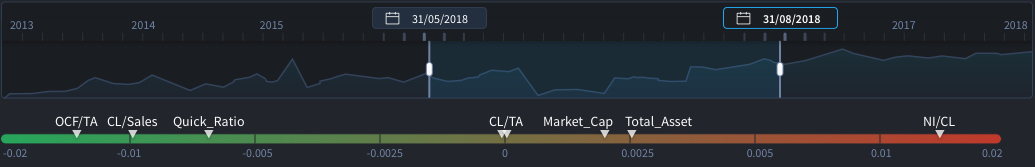
Historical assesment

Shows the marginal and overall PD changes from the earliest to latest in the selected time window

Back to top

Portfolio manager

Portfolio name 1

Portfolio name 2

Portfolio name 3

Portfolio name 4

Create new portfolio

Create new portfolio

Start date: 20/12/2018

Template
There are 3 entities in .csv file with their names or period not matching database.
Entity From To
Shell 01/01/2010 01/05/2010
Cathay Pacific 01/01/2010 01/05/2010
Nestle 01/01/2010 01/05/2010
Some other 01/01/2010 01/05/2010

From start date:

Mar 6, 2016

Matched 30 entities.

Entities matched
Apple Toshiba
Amazon
Tesla
Exxon
BP
BA
Samsung
Toyota
Nissan
Sharp

From start date:

Fine-tune history

Remove the following entities between:
Select entities to remove
Entities

Edit portfolio

Start date:
30 entities since the start date
Entities
Shell Shell Shell Shell
Cathay Pacific Cathay Pacific Cathay Pacific Cathay Pacific
Nestle Nestle Nestle Nestle
Coca Cola Coca Cola Coca Cola Coca Cola
Tesla Tesla Tesla Tesla
BMW BMW BMW BMW

Edit member entity columns

Column 1

Entity

Column 2

Signal

Column 3

12M PD

Column 4

PD change

Column 6

Rating

Column 7

Column 8

Undefined

Member survival history

Entity survival count